Measuring Pipeline Performance
What is a pipeline?
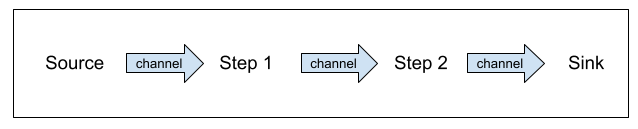
A pipeline is a complex process that is divided into discrete Steps connected by channels. Each Step is implemented as an asynchronous goroutine, a function that executes simultaneously with other goroutines in a program. This allows each Step to execute concurrently as a work item flows through the channels from Source to Sink. The Go programming language provides the channel and goroutine concurrency primitives that make constructing these pipelines straightforward.
The below example demonstrates how the Source feeds work items into the pipeline and how each Step is responsible for completing a discrete part of the pipeline. The channels provide thread-safe communication for work items to transition from one Step to the next and the Sink represents the end of the pipeline.
Each Step has its own runtime characteristics. One Step might require a network call while another Step might be CPU intensive. The channels where these Steps meet to communicate often have slack time as one Step finishes and the next Step is still working. By eliminating any slack in the system, the pipeline will have optimal use of I/O and CPU to reach the best possible throughput.
Slack in the system
The Merriam-Webster dictionary defines slack as cessation in movement or flow. If a Step in the pipeline is not working, then it is experiencing slack. This slack results in under-utilized resources and reduced pipeline throughput.
Let's take a closer look at how work moves through the pipeline. A work item is received from the Source and Step 1 asynchronously works on the item while the Source gets the next work item ready. The Source is now blocked and attempting to send since Step 1 is still processing the last item.
The running pipeline will have work items flowing through each Step and each work item is in a different state. Some of the items are actively being worked on and others are pending transition from one Step to the next. In a perfectly configured pipeline, no work item is pending transition. Each item moves directly from one Step of the pipeline into the next until reaching the Sink. Such nirvana would have zero slack. Measuring the duration of the blockage helps to tune the flow through the pipeline.
Measuring slack
Slack time is measured at the send and receive points of the channel. The below examples are based upon the go blog on pipelines. This Source function will send a finite set of unsigned integers into the channel as fast as it can. To adequately measure the slack time, it is important to remember channel behavior in Go and recognize that the send (out <- n) will block until a goroutine is ready to receive. That is the line where the slack time should be measured.
// source sends individual values into the channel
func source(values ...uint) <-chan uint {
 out := make(chan uint)
 go func() {
   defer close(out)
   for _, n := range values {
     out <- n // this line blocks until the next step is ready to receive
   }
 }()
 return out
}
A goroutine blocked on send is experiencing back pressure from the busy downstream goroutine. It is also important to measure any slack time experienced from the receiving side of the channel. The following Step function illustrates both sides of this process.
In the below example, the range is the downstream receive from the Source. The for loop will block if the Source is not ready to send the next work item. This example also shows that each Step in the pipeline has an upstream and downstream channel. The Step's send time to the downstream channel should also be measured for slack.
// sq is a step function that squares the input values before sending to the next step
func sq(input <-chan uint) <-chan uint {
 out := make(chan uint)
 go func() {
   defer close(out)
   for n := range input { // blocks on receive from the input source
     out <- n * n // blocks on send until the next step is ready to receive
   }
 }()
 return out
}
Custom measurement collection
A bit of custom code can be used to collect and measure slack time- and the interface needed can be simple. The below example has a Record method that will be called each time we send or receive on a channel. The Close method is called at the end to summarize the collected data. As the below example demonstrates, the implementation of TimeKeeper need not be complex. It prints some output to stdout and the Close method can be used to print statistics gathered.
type TimeKeeper interface {
 Record(start time.Time)
 Close()
}
This Timekeeper interface can be applied to the Source function to record each time we send to the output channel.
func source(nums ...uint) <-chan uint {
 out := make(chan uint)
 tk := NewTimeKeeper("source-send")
 go func() {
   defer close(out)
   defer tk.Close()
   for _, n := range nums {
     startTime := time.Now()
     out <- n
     tk.Record(startTime)
   }
 }()
 return out
}
When applying the TimeKeeper to the Step function there are two instances: one captures the slack time around receiving from the upstream Source, the other instance captures the send to the downstream Step.
func sq(in <-chan uint) <-chan uint {
 out := make(chan uint)
 receiveKeeper := NewTimeKeeper("sq-receive")
 sendKeeper := NewTimeKeeper("sq-send")
 go func() {
   defer close(out)
   defer receiveKeeper.Close()
   defer sendKeeper.Close()
   rt := time.Now()
   for n := range in {
     receiveKeeper.Record(rt)
     st := time.Now()
     out <- n * n
     sendKeeper.Record(st)
     rt = time.Now()
   }
 }()
 return out
}
Integrated profiling measurement collection
Pprof is a tool used to integrate with Go for collecting and analyzing profile data. Using pprof is much less invasive to the logic of the channel interactions when compared with the custom measurement collection described above. However, the ease of integration comes with a loss of customizability. One approach to customization is to start measuring slack time with pprof and introduce custom tailored measuring when more finite measurements are needed.
go tool pprof some_profile.prof
go tool pprof http://localhost:6060/debug/pprof/block
If the Go program being profiled typically runs to completion it can be easier to use the runtime/pprof package to create a local file. When a pipeline is fed from a Source that has no end, we need a different approach. The net/http/pprof package has been provided for these scenarios. The pipeline can register it as an HTTP server.
import (
  "log"
  "net/http"
  "net/http/pprof"
  "runtime"
)
func main() {
  mux := http.NewServeMux()
  mux.HandleFunc("/debug/pprof/", pprof.Index)
  go func() {
    log.Fatal(http.ListenAndServe("localhost:6060", mux))
  }()
  runtime.SetBlockProfileRate(1)
  ...
}
It is important to note the runtime.SetBlockProfileRate(1). This is the line that will configure the profiler to capture block rate. There are more features in the pprof packages, but we are interested in the block rate of the slack in the pipeline.
Once the pipeline is running, the block profile is available via the command from earlier: go tool pprof http://localhost:6060/debug/pprof/block. This will launch the pprof tool to download the current block profiling. The pprof tool can create an svg like the sample illustrated in the below image.
This graph demonstrates that there are three goroutines running in an errgroup. The pipeline Source has experienced 1.73 seconds of delay blocked in a select statement – attempting to send to channel or wait for a context done signal. Furthermore, there are two goroutines that are spending time waiting on channel receive – both are for-range statements.
Given an understanding that this example pipeline is constructed to connect Source→Step→Sink we know that:
- The Source has thus far spent very little time waiting for the Step. The Step seems to always be waiting for Source to send the next value
- The Step has added a 7-second delay to that seen by the Sink's total 17 seconds spent blocked on channel receive.
- The Source is causing the largest slack time of 10 seconds where the image shows the Step is blocked on the receive channel.
The slack time is exposed by viewing the delay time measured in the block profile. This is but a glimpse into the functionality available via the built-in profiling library and tooling. There are many online resources that provide detailed information about pprof features.
Interpreting the results
Now that you have empirical data showing which Steps are slower, below are some questions to ask when interpreting results:
- Is Step 1 showing a high average duration blocked on send?
- Is the Source spending a lot of time waiting for Step 1 to receive new input?
- Can the performance of the slower Step be improved? If not, there are techniques to change the Steps.
Most attention should be toward back pressure from slow Steps. A slow Step could be converted to have a worker pool so that more than one item is in progress at a given time. Perhaps you can implement fan out, fan in for higher concurrency. Sometimes order is important when implementing fan out fan in.
Putting a buffered channel in front of a slow Step will not improve throughput; this will only delay back pressure. However, a buffered channel can help smooth out an inconsistent duration of a Step. When the Step slows down the buffer will fill and, since the Step works faster on other work items, the buffer will drain.
It doesn't matter if a pipeline is running in a cloud service or on-premises. There are CPU and memory resources reserved for use by the pipeline. Removing slack ensures those resources are put to consistent use to achieve the highest possible throughput.