Partner POV | Remediate IT issues faster with Workspace ONE Intelligence
In this article
This article was written by Andrew Scott, VMware Product Marketing Manager on the Digital Employee Experience team.
Massive technological advances have created new ways to work, more accessible information, and easier-to-use devices and applications — and today's workforce is benefiting from these improvements. However, the increasingly complex supporting architecture required can create challenges for IT teams. Solving an increasing number of IT issues can lead to friction and has resulted in organizations depending on support teams to handle more tickets of greater variety. Decision-makers are looking for solutions that allow them to equip IT teams to remediate issues faster and more smoothly.
To solve simple and complex IT problems, it is critical for organizations to build out a process that allows IT support to be more productive with their limited resources. With Workspace ONE Intelligence, organizations benefit from proactive problem identification and a seamless line of communication between L1 IT support and employees. Reactive problem solving will surely remain a core function, but identifying problems before they are reported on the user side can help organizations to "shift left" and allocate more resources to closing more complex tickets. The goal is to decrease mean time to resolution (MTTR) overall while increasing the number of tickets that are closed.
To illustrate the process, let's walk through a scenario of an IT admin using Workspace ONE to monitor a KPI, identify a potential user issue, and expeditiously remediate the problem in collaboration with the end user.
Building a Workspace ONE Intelligence workflow to monitor device health
There are many statistics that IT depends on to assess the health of different components in an environment. Workspace ONE can monitor critical data on device performance, application performance, and other metrics that indicate how IT issues may be affecting employee experience. This data allows IT admins to identify issues more quickly, sometimes even before the user has identified an issue themselves.
Inside Workspace ONE Intelligence, IT admins can create workflows that trigger an alert when a specific usage threshold (or other experience metric) is hit on a device, stemming from an application, device, or other source. In this example, CPU usage is identified as a metric that can significantly predict the quality of an employee's experience. IT creates an alert to proactively let them know if an employee's device has a high CPU usage, allowing them to take steps to begin the remediation process.
In this example, IT admin Nick wants to monitor CPU health of users and create a workflow that will trigger a notification if a user's device reaches greater than 75% usage. Within Workspace ONE Intelligence, Nick selects a data source from which to pull data, identifies the target metric, and sets a relevant threshold for the notification system.
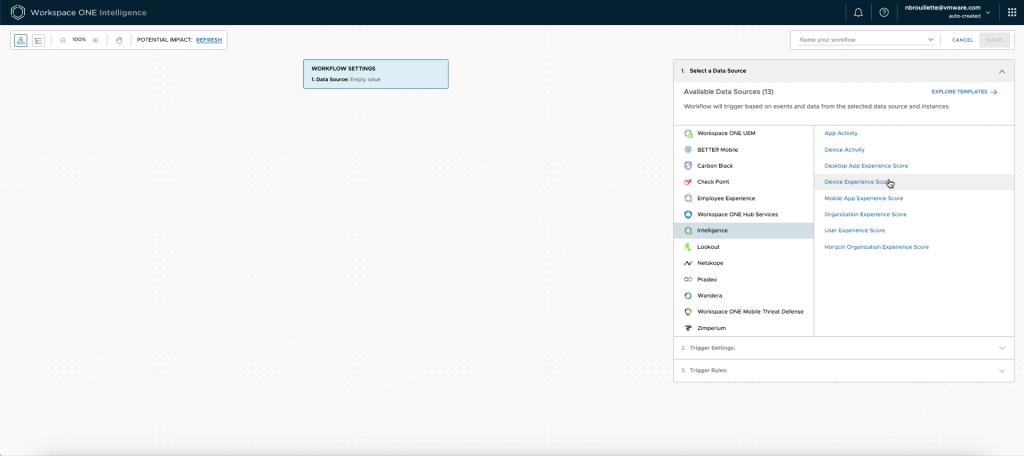
Identify the desired data source
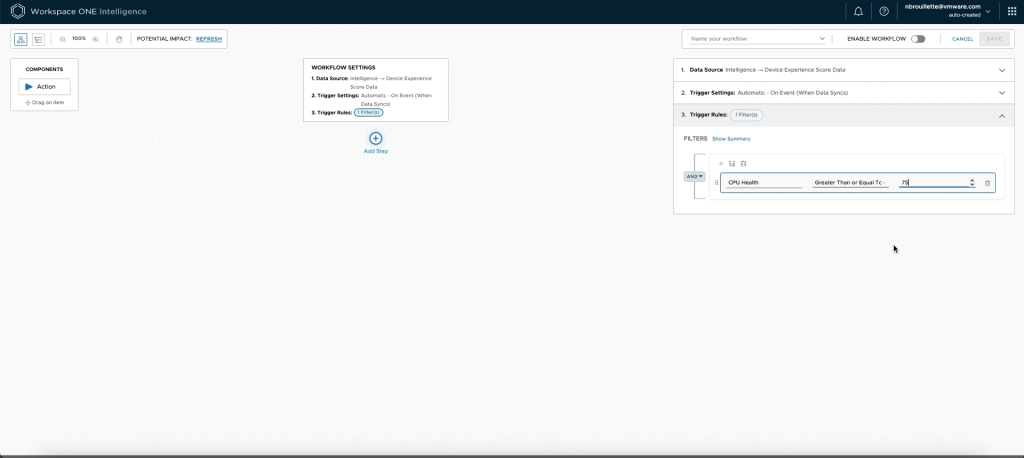
Select a KPI to monitor and set the threshold
But where does the notification go? Well, it can really go wherever you want. In this example, Nick wants Workspace ONE to fire a notification to an IT Slack channel for someone to pick up. He selects the Slack Web API from a list of available connections, designates the channel name, and writes the notification message template to include macros that autofill pertinent information. He also creates a second action that creates a ServiceNow ticket for the admin who picks up the issue from Slack. Both of these motions are typically bottlenecks that increase MTTR. Automating the collection and dissemination of device data allows IT to begin remediation quicker.
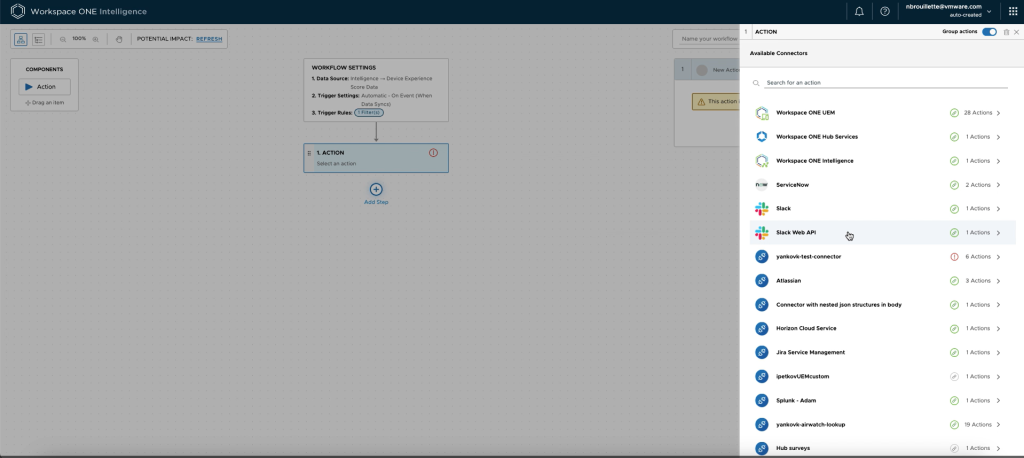
Choose an application to send the notification
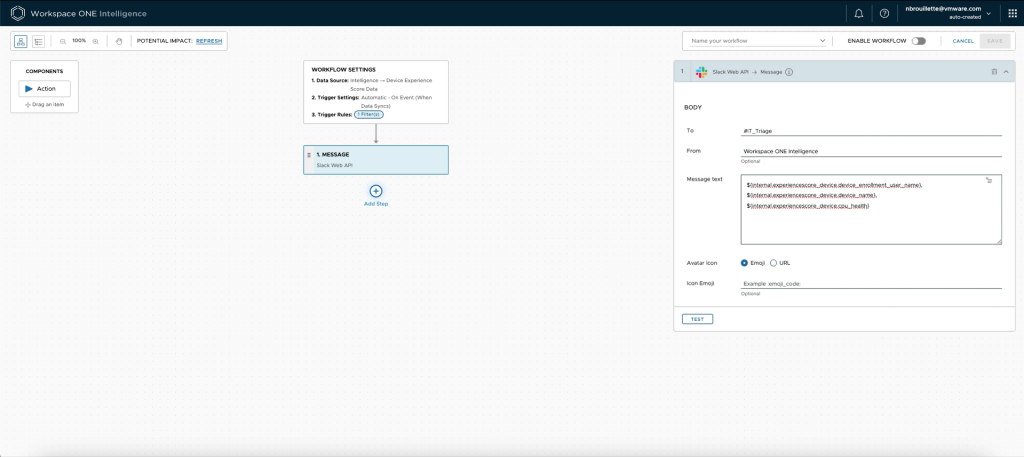
Format the notification message

Add a ServiceNow workflow to generate a ticket
Acting on a notification in Intelligence
Once a message has been sent in Slack and a ticket created in ServiceNow, an L1 admin will need to pick up and begin working to resolve the ticket. In the Workspace ONE Intelligence dashboard, the admin can search the device name that was automatically pulled into the Slack message. The Intelligence dashboard provides data on many performance metrics; for this use case, the admin navigates to CPU Health in the Experience tab.

Workspace ONE Intelligence dashboard
He initially verifies the issue by checking the current performance score, finding it at 95% usage. To dive deeper, the admin looks into the timeline view of the device's CPU health and identifies the date that the device began having performance issues, February 24, in this instance. That information is cross-referenced with the boot logs, where there is a record of an OS update on the same date. The two pieces of information may be related, giving the admin a place to begin troubleshooting.
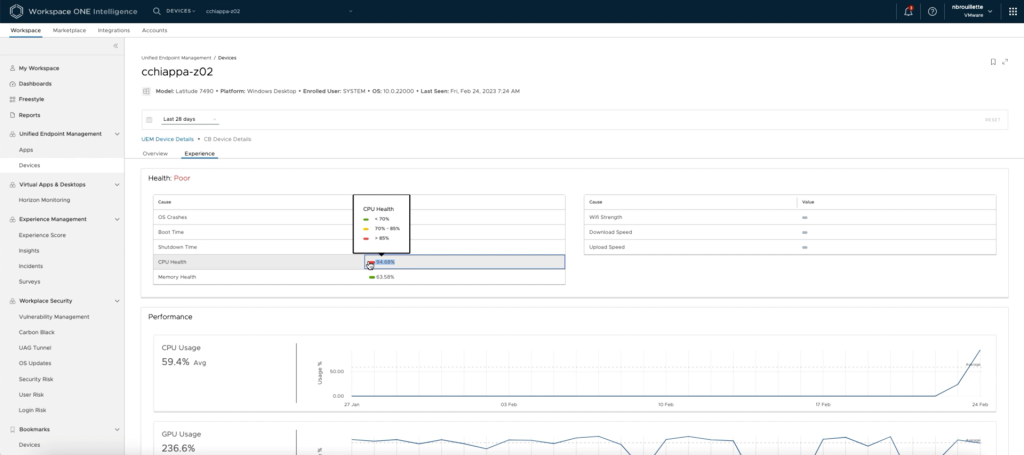
Confirm the trigger metric
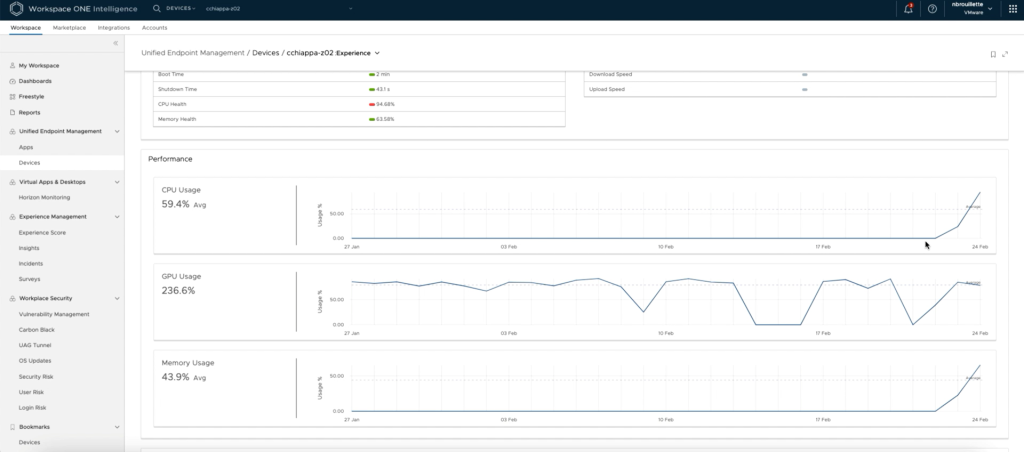
Review historic CPU usage data
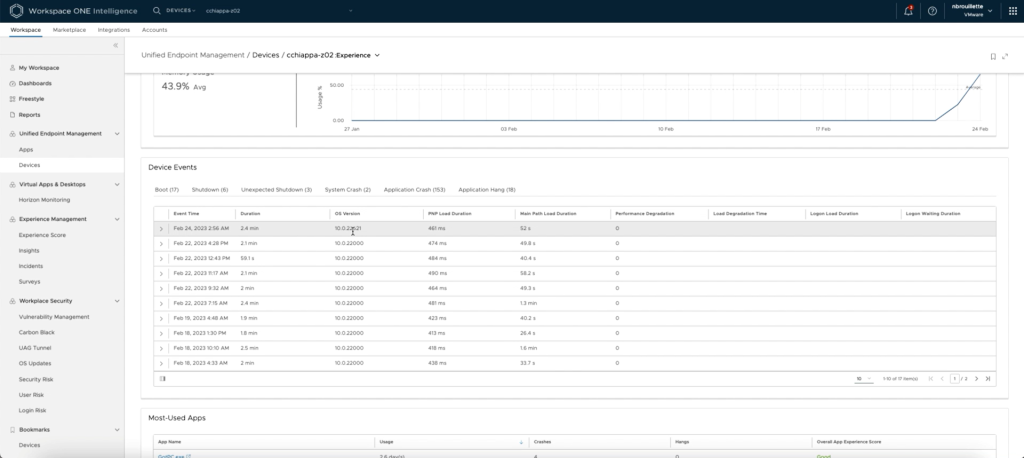
Open the device boot log to cross-reference
Learn more about Workspace ONE Intelligence
All this data is available and visible in Workspace ONE Intelligence. Intelligence not only helps organizations access and analyze device and application data, but it also allows organizations to decide how they manage that data and act on it. These use cases track across devices, operating systems, applications, and locations, allowing IT teams to resolve more tickets more quickly and efficiently. These automations give your remote or hybrid workforce the IT support they need to continue performing wherever they are.
This example is just one of many ways that Workspace ONE enables an Anywhere Workspace across your organization by providing proactive remediation through data monitoring, leading to a powerful and dependable employee experience.

